Revised comparison of modal theorem provers
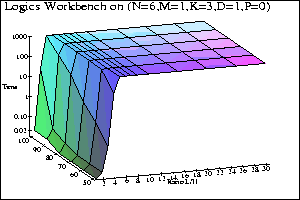
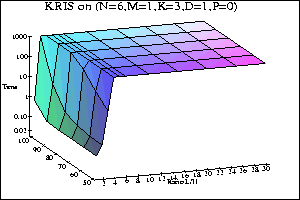
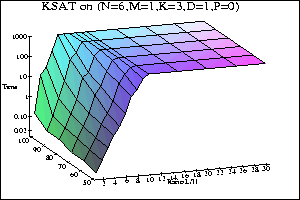
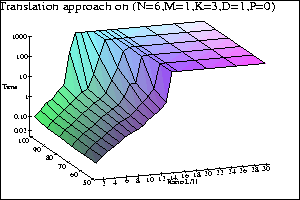
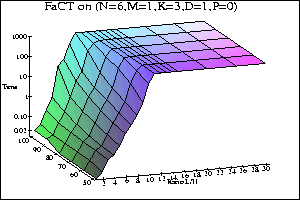
The following pictures show the performance of
the Logics Workbench,
KRIS*, KsatLISP, the translation approach using SPASS, and
FaCT on the parameter setting PS13 (N=6, M=1, K=3, D=1, P=0).
Again we can improve the performance of some procedures by allowing subformula reordering
on the input formulae. The following pricture shows the performance of
KsatLISP with sorting on the parameter setting PS13.
It is interesting to compare the percentile graphs for KsatLISP without and with sorting
on (N=6, M=1, K=3, D=1, P=0) with the median CPU time graphs persented in
Giunchiglia, Giunchiglia, Sebastiani, and Tachella (1998). They consider only the
parameter setting (N=4, M=1, K=3, D=1, P=0) where a dramatic improvement can be seen after
enabling sorting. However, for sets of random formulae generated with N>4 the improvement
with sorting is less dramatic.
Top: Contents |
Previous: Guidelines for generating more challenging problems |
Next: Semantic versus syntactic branching
